Landscapt — Reporting & Dashboards
Know your numbers without a spreadsheet.
About 100 built-in reports, a drag-and-drop dashboard builder, and a company-wide scorecard — always current, no manual reconciliation.
Dashboards
Company Scorecard — Q3
Custom dashboardRevenue by Week
Margin Trend
New Clients
212
+18 this month
AR Days
27
Target 30
Close Ratio
38%
Target 45%
Capabilities
What reporting & dashboards actually does.
About 100 Built-In Reports
Job costing, revenue, receivables, production-rate accuracy, and dozens more — covering day-to-day operations without building a query from scratch.
Drag-and-Drop Dashboard Builder
Build a custom dashboard from any report's output — bar, line, gauge, or crosstab visuals, with top-N grouping and formula columns for derived metrics.
Graphics Library
A catalog of pre-made panel-level visuals — system-defined and your own saved ones — that drop into any dashboard from the builder or the Report Center.
Company-Wide KPI Scorecard
Financial, operations, and sales targets roll up into one scorecard that's always current — no spreadsheet to maintain.
Scheduled Delivery
Set a report to run on a schedule and land in the right inbox automatically, instead of someone remembering to pull it every week.
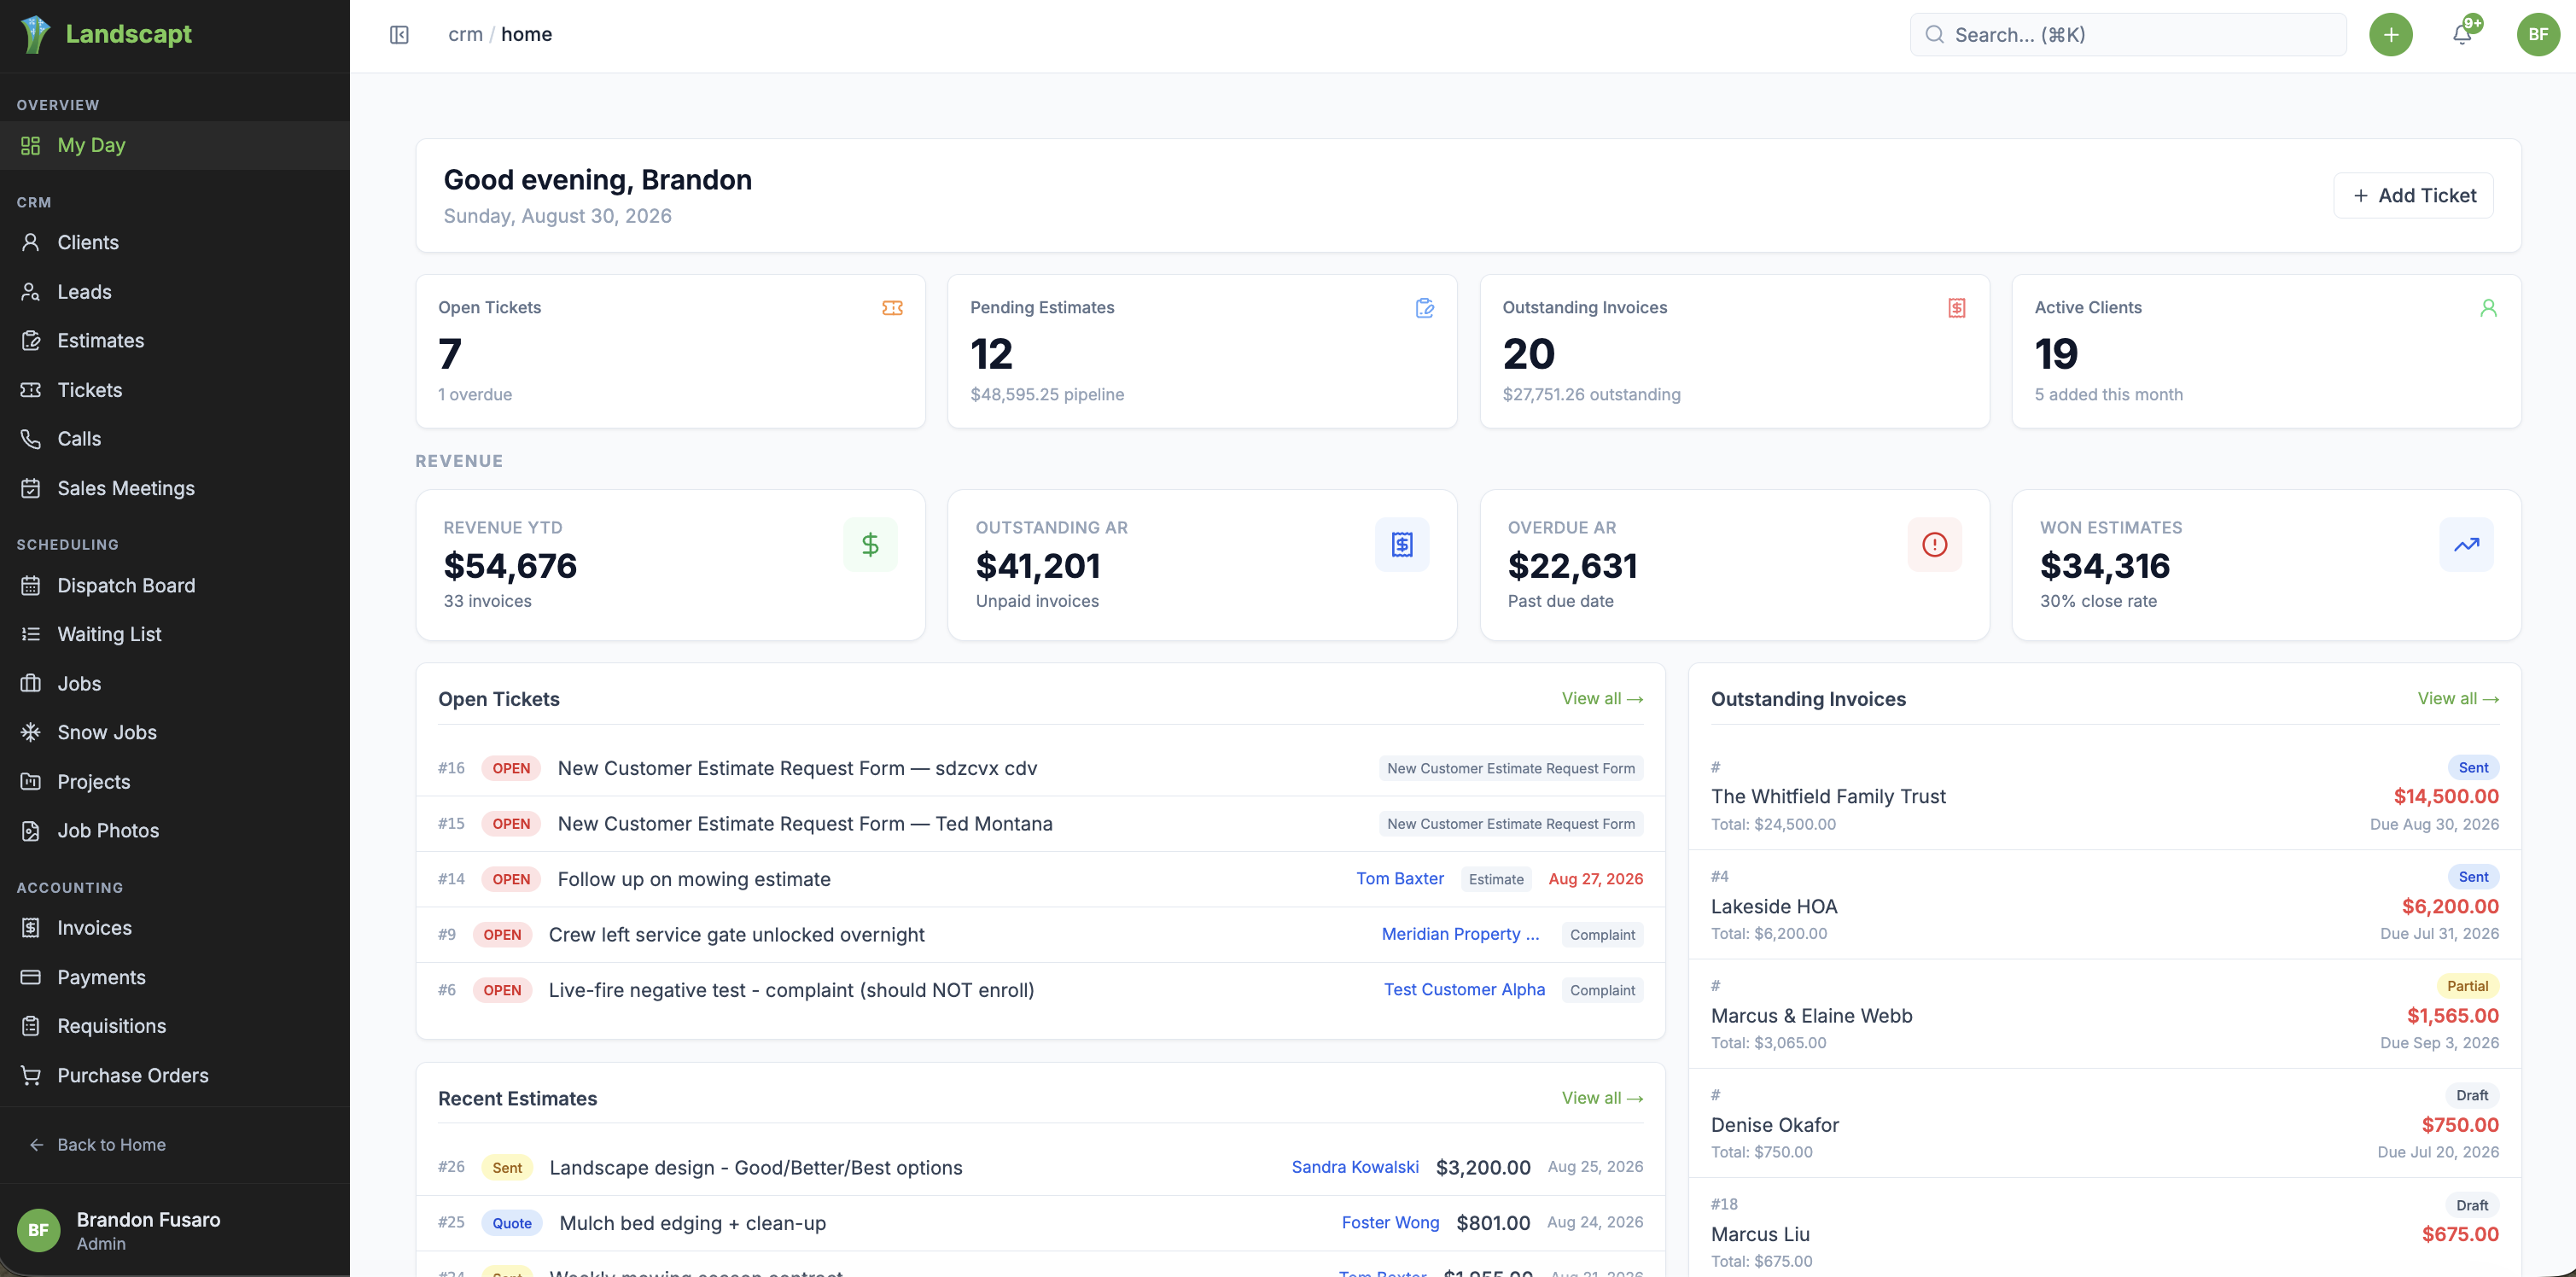
See it in action
A real screen, not a mockup.
My Day
See it running on your own operation.
30-day free trial. No credit card required.
© 2026 Landscapt. All rights reserved.